Full counts in baseball are a very unique situation. The only way to change the base out state is if the batter gets on base or gets out. Baseball would be easy if the hitters could just swing at the balls in the strike zone and take the balls out of the strike zone, but as much as we want the rectangular box on our screen to be correct, umpires are fallible.
Here at Inside Edge, we took an approach with a probabilistic model that assigns a probability of a pitch being called a strike if taken. Pitch location is one of the most important factors in the case of a 3-2 count. Called strike probabilities were generated for all 3-2 counts during the 2023 MLB season and were paired with batter actions (take, miss, foul, or in-play) and outcomes for non-fouled pitches (BB, HBP, TB). The outcome metric is as follows:
(BB + HBP + TB) / (pitches - fouls)
There were 36,767 pitches in the study and the metric’s league average was .547.
Confusion Matrix
Full count pitches were classified as probable strikes or probable balls. The two matrices below show the numbers of each group.
The values in green show when the hitter made the ‘correct’ decision on either swinging or taking a pitch. If we just look at probable balls, 46.1% of probable balls were swung on and 11.1% of probable strikes were taken.
When To Swing
The optimal point to swing or take a pitch in a 3-2 count was calculated at 26.1%. The best performance on full counts is obtained when the hitter swings at any pitch with a called strike probability greater than 26.1%. If it is less than that mark, the batter should take the pitch.
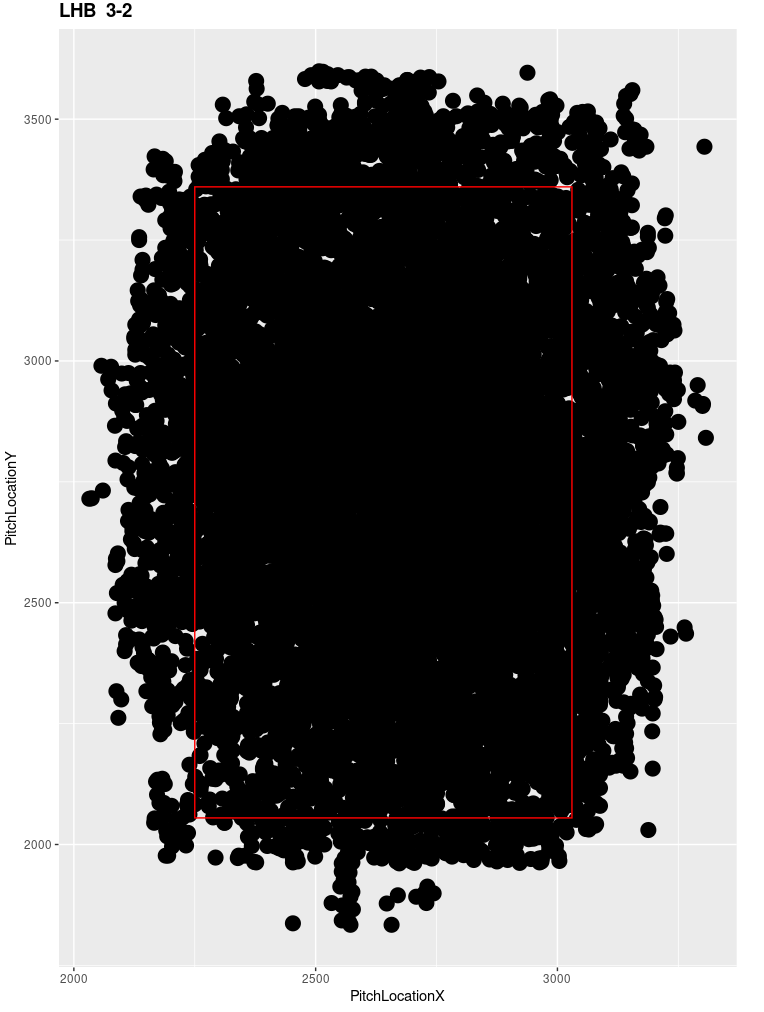
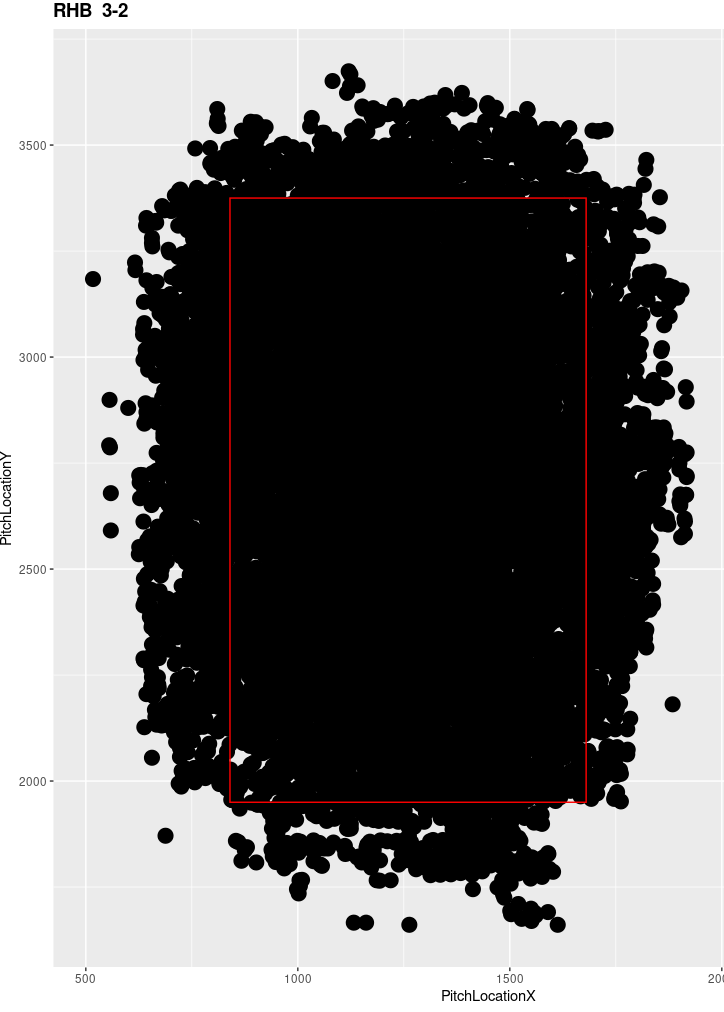
Below are two plots that show the optimal swing zones for a left-handed batter and a right-handed batter from the pitcher’s point of view.
The recommendation is to only swing at pitches in the dark areas of the zone and take pitches outside said areas.
Results
Optimizing full count swing decisions based on the 26.1% cutoff, can lead to a 54.2% swing accuracy on probable strikes, a 4.5% increase from the 2023 numbers above.
The average outcome metric for the optimal approach is .655, a .108 improvement over the .547 league average in the 2023 MLB season.


