Last time in our Best of the Best series, the focus was on various ways to measure “clutch” performance, and we showed how the Best of the Best teams demonstrated the ability to be clutch in eight different ways.
In this installment of the Best of the Best NFL teams, it’s all about the “little things”.
* Little things add up to big things in football just as they do in most sports. They are events in a game that don’t happen quite as often as a “standard” play such as your basic rush or pass with no extracurriculars, but they have real impact on the result of the game.
As usual, we turned to our Remarkable database with thousands of data points to make the research easy. There were some areas that surprised us about their apparent lack of any correlation with the Best of the Best teams. Things like penalties, for example, didn’t correlate much even when looking at it 15 different ways (offense, defense, small penalties, big penalties, red zone penalties, etc.).
However, there were five key ways in which the Best of the Best teams took care of the little things last season:
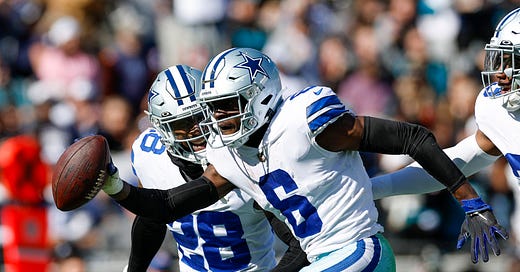
Takeaways -- They don’t happen often — less than 1.3 times per game for each team on average — but when they do happen, they can change the game. The Cowboys, 49ers, and Eagles ranked 1, 2, and 3 in the league, respectfully. The Bills, Bengals, and Chiefs were also excellent or above average when it came to Takeaways.
Sacks on Early Downs -- The BoB group performed well in terms of Sacks overall, but (with the exception of the Bengals), they really shined at getting those drive-killing, early-down Sacks. The Cowboys and Eagles tied for first in the NFL with 35 Sacks on first and second down. League average was 23.
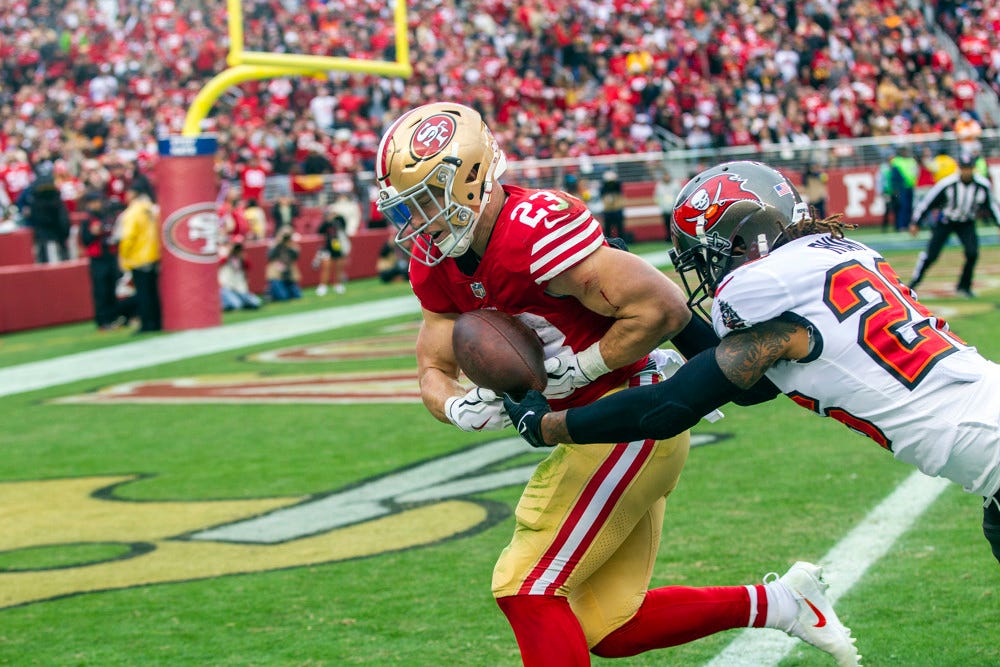
Answer Back Percentage -- The ability for an offense to bounce right back with points after your defense is scored upon is what Answer Back Percentage tells us. All six Best of the Best clubs were in the top half of the league here. The 49ers answered back an exceptional 51% of the time — the only team to do so more than half of the time in drives that followed their opponent scoring.
Average Drive Starting Position -- This is one way to measure the effectiveness of the Special Teams Return unit, and the defense because those two things ultimately decide where each drive will start. The Best of the Best teams benefitted from better starting position on offense than most teams.
Turnover Margin -- This is related to the first Little Thing (Takeaways), but shows how the BoB group was very good at reducing Giveaways, too.
Other Observations
You might be wondering about other parts of the game that qualify as Little Things. We were, too. The cutting room floor for this chapter includes some areas where a few Best of the Best teams performed well, but not all of them did. For example:
Penalties. We figured the Best of the Best would commit fewer penalties than their opponents. The data was mixed.
The Bengals, Chiefs, and Eagles committed fewer penalties than their opponents, but the other three BoB teams didn’t.
The Bengals were the only real standout in the group, ending up 3rd in the NFL in Net Penalties (17 fewer than their opponents).
There was one specific way that the Chiefs reached the top of the list, and that was Penalties on Offense. They tied the Falcons for fewest (36) and they led the league with a -30.21 EPA on penalties. The average offense had -41 expected points due to being flagged.
Special Teams
We looked at the total EPA on all special teams offense plays, and only the Bills ranked in the top half of the league (5th).
This includes Punts, Kickoffs, Field Goal Attempts, and any other Special Teams play where the offense was on the field.
In terms of Defensive Special Teams the Bills again were the only BoB team to crack the top 8 in EPA. The rest of the group was mediocre or poor in this department.
This includes Punt Returns, Kick Returns, blocking a a field goal or extra point, etc.
Dropped Passes, Missed Tackles, 2 point Conversions, and 4th Down Conversions allowed were some of the other surprising ways in which the data didn’t really support a Best of the Best lesson to be learned.
What about my team? Where do they rank in these categories?
To see the complete ranking lists for every ‘Little Things’ metric, go here or click the image below.
The information in this post was powered by Remarkable, Inside Edge’s award-winning data insights application. Remarkable is used widely among broadcasters, teams, sports betting and media partners. For more information on Remarkable, please visit inside-edge.com/remarkable.


