Welcome back to Best of the Best. Last time we shared common trait number 1 among the very best NFL teams in the 2022 season -- they dominate from the jump -- taking control of games starting from their opening drive, through the 1st Quarter and 1st Half.
Now for common attribute #2: The clutch factor.
How can we measure a team’s ability to be “clutch”? What is “clutch”, anyway? We’ll define it as performing well in situations that have more than a usual amount of magnitude. That can be at the game level (e.g., having to beat a tough opponent on the road) or at the play level (e.g., getting the job done in close and late situations).
After slicing and dicing the data in thousands of ways, we found many metrics that quantify “clutch” pretty well. The Best of the Best group was perched at (or near) the top of the league in most of those areas, and in particular these eight:
Third Down Conversion Rate -- Converting Third Down plays into First Downs doesn’t win games all by itself, but the team with more third down conversions won 68.8% of games in the 2022 regular season. And it was certainly a huge factor for the very best teams in the league last season. Five of the six Best of the Best teams ranked in the Top 6 in the NFL in Third Down Conversion Rate, and all of them were in the Top 8. They also took the five of the top six spots at Conversion Rate on 3rd + 4th Down plays.
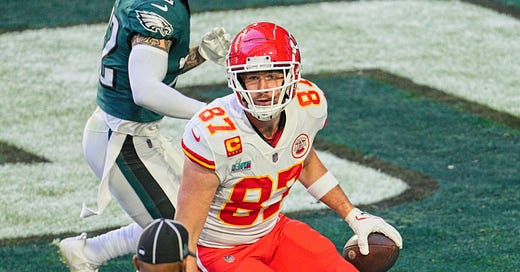
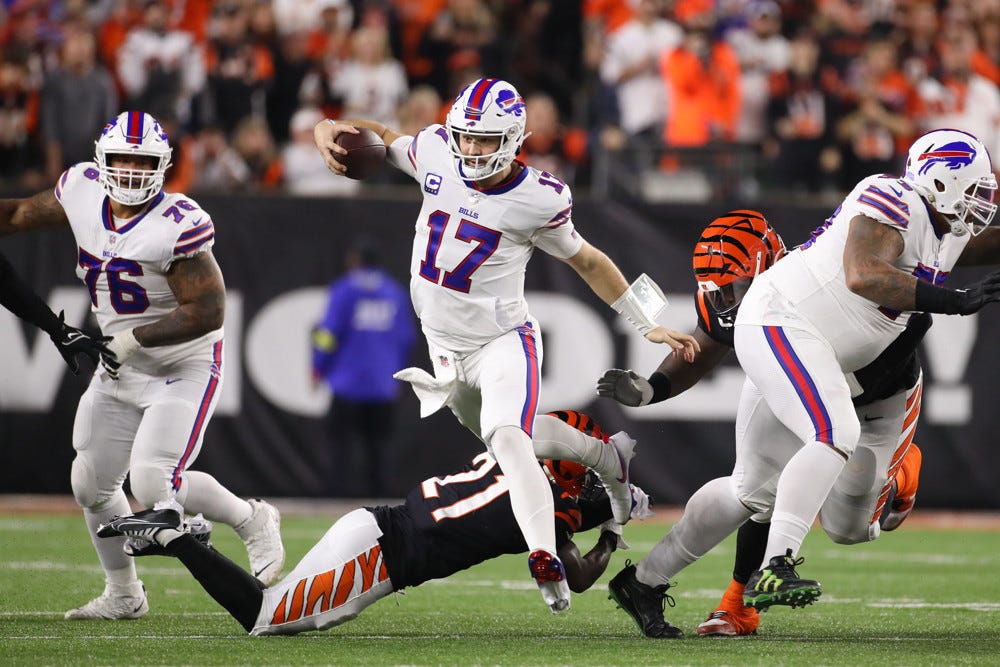
Third Down Conversion Rate with 10+ Yards to Go -- The average NFL team converted just 19% of the time on 3rd and 10+ yards to go situations. The Chiefs converted 28 of 60 (a whopping 47%) of such plays. For more context at how insanely good that is, the Bills ranked second with 31%.
Red Zone Touchdowns -- The ability to polish off a trip to the red zone with a touchdown is something the Best of the Best teams did very well. They occupied six of the top seven spots, with the Lions sneaking into the mix. The Chiefs, again, led in this category.
Red Zone Points Per Drive Allowed -- On the flip side, the BoB group did an excellent job of keeping scoring to a minimum once their opponent reached the red zone. The only exception was the Chiefs, but hey, every team has at least one weak spot.
Win Percentage vs Top 10 Offenses -- The league average win rate versus Top 10 Offenses is just 32 percent. Each of the BoB teams was at 60+%.
Win Percentage on the Road -- Visiting teams won only 43% of the games played last season. But every BoB team except the Cowboys had a 67% or higher Win Rate on the road.
Successful Play Pct in Close & Late Situations -- The definition for Close & Late is any play in the 4th quarter that occurs with at least a 33% Win Probability. The definition for Successful Plays is gaining at least 50% of the Yards to Go on Downs 1 and 2, and converting the First Down on Downs 3 and 4 (if applicable). The BoB had five teams in the top 8 in the league.
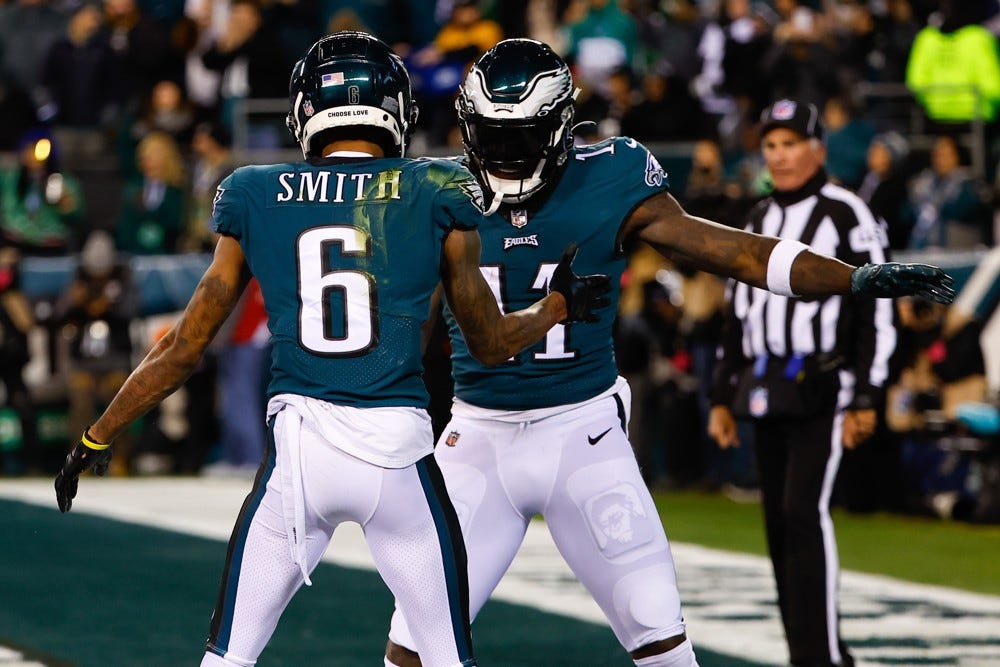
Defense EPA in Close & Late Situations -- The Bills, Eagles, and Cowboys ranked 1, 2, and 3 in the league respectively when it came to Expected Points Added per play on Defense in Close & Late situations.
What about my team? Where do they rank in these categories?
To see the complete ranking lists for every ‘Clutch’ metric, go here or click the image below.
The information in this post was powered by Remarkable, Inside Edge’s award-winning data insights application. Remarkable is used widely among broadcasters, teams, sports betting and media partners. For more information on Remarkable, please visit inside-edge.com/remarkable.


